
Three Other Metrics Show How Badly Ohio Is Doing Compared to Other States (And Then There Are Cocaine Overdose Deaths)
Ohioans can only hope that the next governor will stop this insanity by adopting a Reaganesque bold colors agenda as I laid out two years ago.

I’ve previously detailed Ohio’s tepid private sector job growth (44th since 1990, 35th since start of pandemic, and weak-to-negative growth across most industries since 2018), JobsOhio’s utter ineptitude (even based on its own numbers job growth has gotten weaker the longer it has existed), declining education results (double digit declines for 4th and 8th graders since 2011), stagnant population growth (Ohio’s growth has been anemic for decades, a majority of counties are hollowing out, and we are losing key demographics), skyrocketing state spending far exceeding inflation and population growth (77% net growth since 2012 or more than 5% per year), and an anticompetitive business tax climate and state income tax rates (on both measures Ohio is in the bottom twelve among the states). I won’t even get into the fact that Ohio has one of the most lenient abortion laws, widespread gambling, legalized marijuana, and top ten drug overdoes deaths, thereby making Ohio not the “Heart of It All,” but the vice capital of America. In this post, I want to cover a few other economic areas in which Ohio finds itself at the back of the pack. I keep waiting for Mike DeWine, Jon Husted (now Jim Tressel), and anyone from the Ohio General Assembly to refute what I write, but they don’t because, well, they can’t and, heretofore, voters haven’t held them accountable for these weak results across so many areas (partially because, knowing Democrats can’t win statewide, the Ohio media—Journalists In Name Only—protects Establishment Republicans lest they report honestly about them thereby resulting in a Trump-like figure gaining power).


First, I’ve mentioned in previous posts that Ohio has the fourth most taxing jurisdictions in America. Based on an analysis by the Mercator Center, Ohio also has the sixth highest regulatory burden in the United States. As of 2023, Ohio’s regulatory restrictions total 246,033. Mercatus defines a regulatory restriction as “a metric designed to act as a proxy for the number of prohibitions and obligations contained in regulatory text, as indicated by the number of occurrences of the words and phrases 'shall, ‘must,' 'may not,' ‘required,' and ‘prohibited' in each state’s regulations." Ohio, along with Texas, is the only Republican-led state in the top ten most regulated states. Worse still, Ohio is the only Republican trifecta state with a supermajority in the state legislature in the top ten most regulated states. In Texas’ defense, it is far bigger and more populous than Ohio with complex oil, gas, refinery, and shipping industries. What is Ohio’s excuse for being so over regulated? Based on comparing Ohio to the other states, Ohio over regulates these policy areas:
Environmental Protection, Public Utilities, and Natural Resources
Industry, Commerce, and Development
College and University
Social Assistance
Security, Justice, and Corrections
Taxes and Public Finance
As to industries, Ohio also over regulates insurance carriers and related activities. Given the seven areas of overregulation, there likely is a lot of low hanging regulatory fruit to pluck if the DeWine-Tressel Administration and the Ohio General Assembly instituted what I proposed during my 2023 gubernatorial exploratory run; namely, name a Chief Deregulator to attack the Leviathan, institute a regulatory notice system for citizens and businesses to inject transparency into the process, and institute a requirement to eliminate four regulations for every proposed new or amended regulation, as well as dig into the depths of state government for cuts and reforms.

The second issue is Ohio’s unemployment rate. Our elected officials love to cite Ohio’s relatively low unemployment rate (4.4%) as proof of their good stewardship. I use the word “relatively” intentionally, as Ohio’s rate is very relative. Specifically, compared to the other states, Ohio’s unemployment rate was the 35th best in December, which means more than two-thirds of that states had BETTER unemployment rates. Over the last year, Ohio’s rate looks even worse. Ohio went from an unemployment rate of 3.6% in December 2023 to 4.4% in December 2024, which is an increase of 0.8% over twelve months. That increase was worse than all but nine states, which indicates increasing dark skies over Ohio.

The last issue is Ohio’s overall economic health. The broadest measure of our economic health is Gross Domestic Product (GDP) growth over time. The U.S. Bureau of Economic Analysis publishes data on state GDP growth every year. That data has a one year lag due to revisions required in the year that just ended. In reviewing the GDP data for all fifty states from 2000 to 2023, Ohio again comes in at the back of the pack. For the entire period, Ohio’s GDP growth is the 42nd best in America, with 31.2% growth from 2000 to 2023, or just 1.36% growth per year on average. For the DeWine-Husted era, Ohio does slightly better at 34th best, which still puts Ohio in the bottom third among the states. From 2019 to 2023, Ohio’s GDP growth increased 5.3%, or 1.33% per year on average.

Comparing Ohio’s GDP growth to its state spending provides a revealing anecdote. Specifically, in 2000, Ohio’s spending totaled 3.55% of its GDP. As the years go by, the percentage increases each year except for dips during budget deficits. In 2020, Ohio's spending as a percentage of GDP passed the 5.0% level for the first time. In 2023, it stood at 5.32%. From 2000 to 2023, Ohio’s spending as a percentage of GDP increased by 66.8%, or 2.9% per year on average. This trend means that state spending is increasing at a faster pace than Ohio’s economy is growing (2.9% versus 1.36%). That trend is problematic and reveals a spending mentality more in line with a progressive, big spending blue state. Shouldn’t we expect state spending to grow more slowly than our economy?

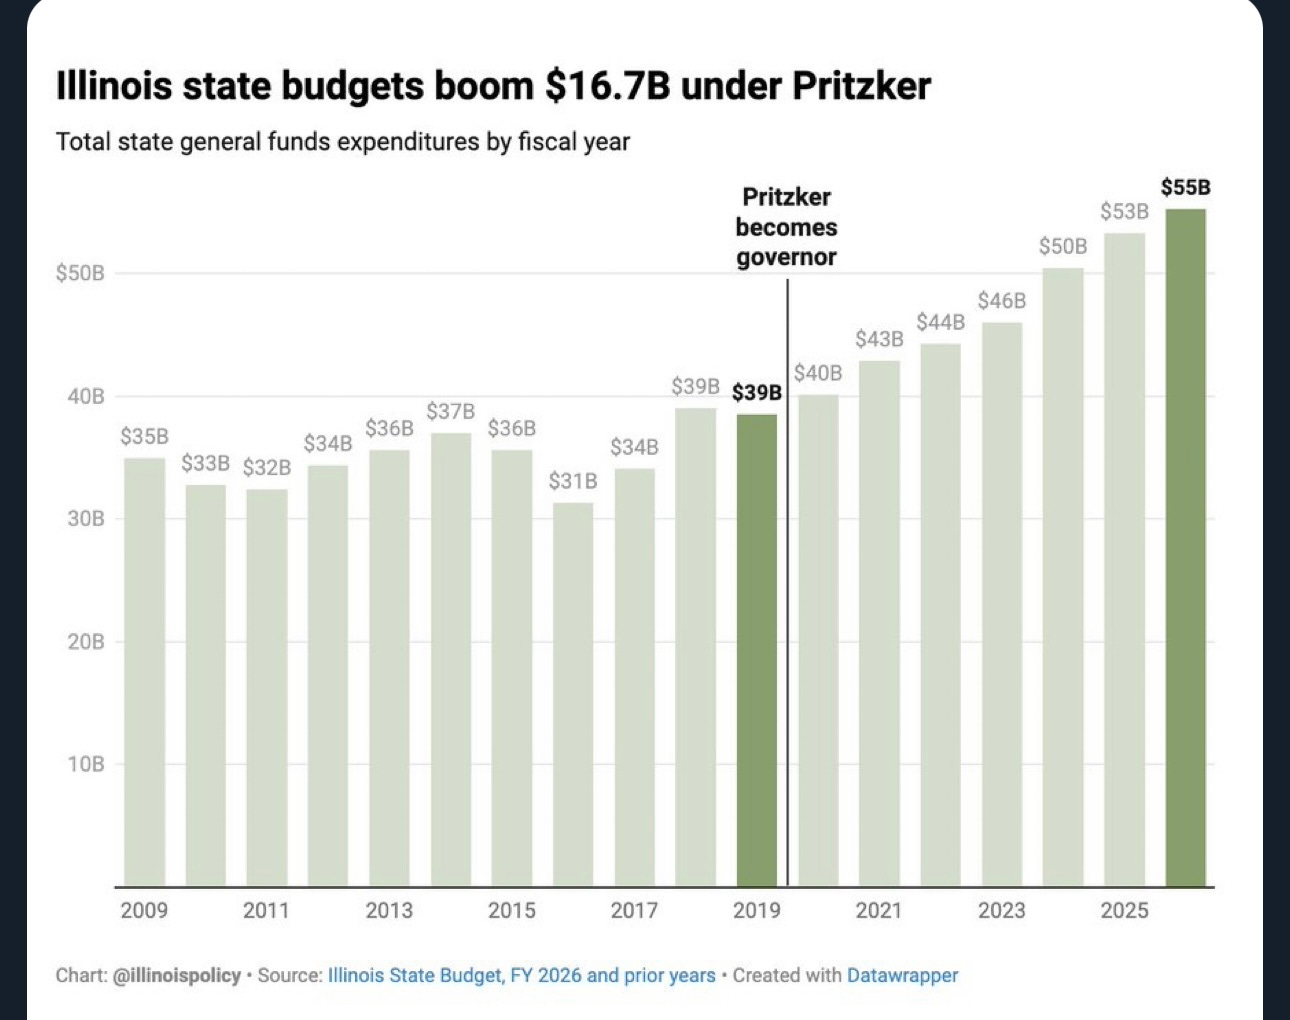
For example, as I’ve detailed, if DeWine’s proposed budget for the next two years is adopted, Ohio’s annual spending will hit $46.7 billion. From 2011 to 2027, Ohio spending will have jumped by 70.3%. In comparison, progressive Democrat supermajority trifecta (and going bankrupt) Illinois during the same span will have increased spending from $32 billion to $55 billion under Democrat Governor J.B. Pritzker’s proposed budget, which represents an increase of 71.9%—or just 1.6-percentage points more than Ohio. Let me repeat that for the kids at home who may have breezed over that line: Ohio’s trifecta supermajority Republican elected officials spend taxpayer funds at the same rate as Illinois’ trifecta supermajority Democrat elected officials. Is that what you are voting for? With Republicans like this, who needs Democrats?
So, to review when it comes to Ohio:
It has one of America’s weakest private sectors;
It has one of the most ineffective economic development entities;
It has declining educational outcomes;
It has a stagnant or declining population;
It has exploding government spending;
It has a poor business tax climate and noncompetitive state income tax;
It has one of the highest number of local taxing jurisdictions;
It has among America’s most regulated economies;
It has one of the highest unemployment rates; and
It has a bottom ten economy in terms of growth.
And, folks, I must say this clearly: those outcomes are based on hard data, not my opinion. I wish those results were opposite of what they are, but they are not. There is not a single proposed piece of legislation in the Ohio General Assembly currently that would change any of these outcomes. Not one. In contrast, the legislature already extended JobsOhio’s activities to 2052 despite its decades-long failures and DeWine’s proposed budget for the next two years increases spending in step with Pritzker in Illinois. Ohioans can only hope that the next governor will stop this insanity by adopting a Reaganesque bold colors agenda as I laid out two years ago.
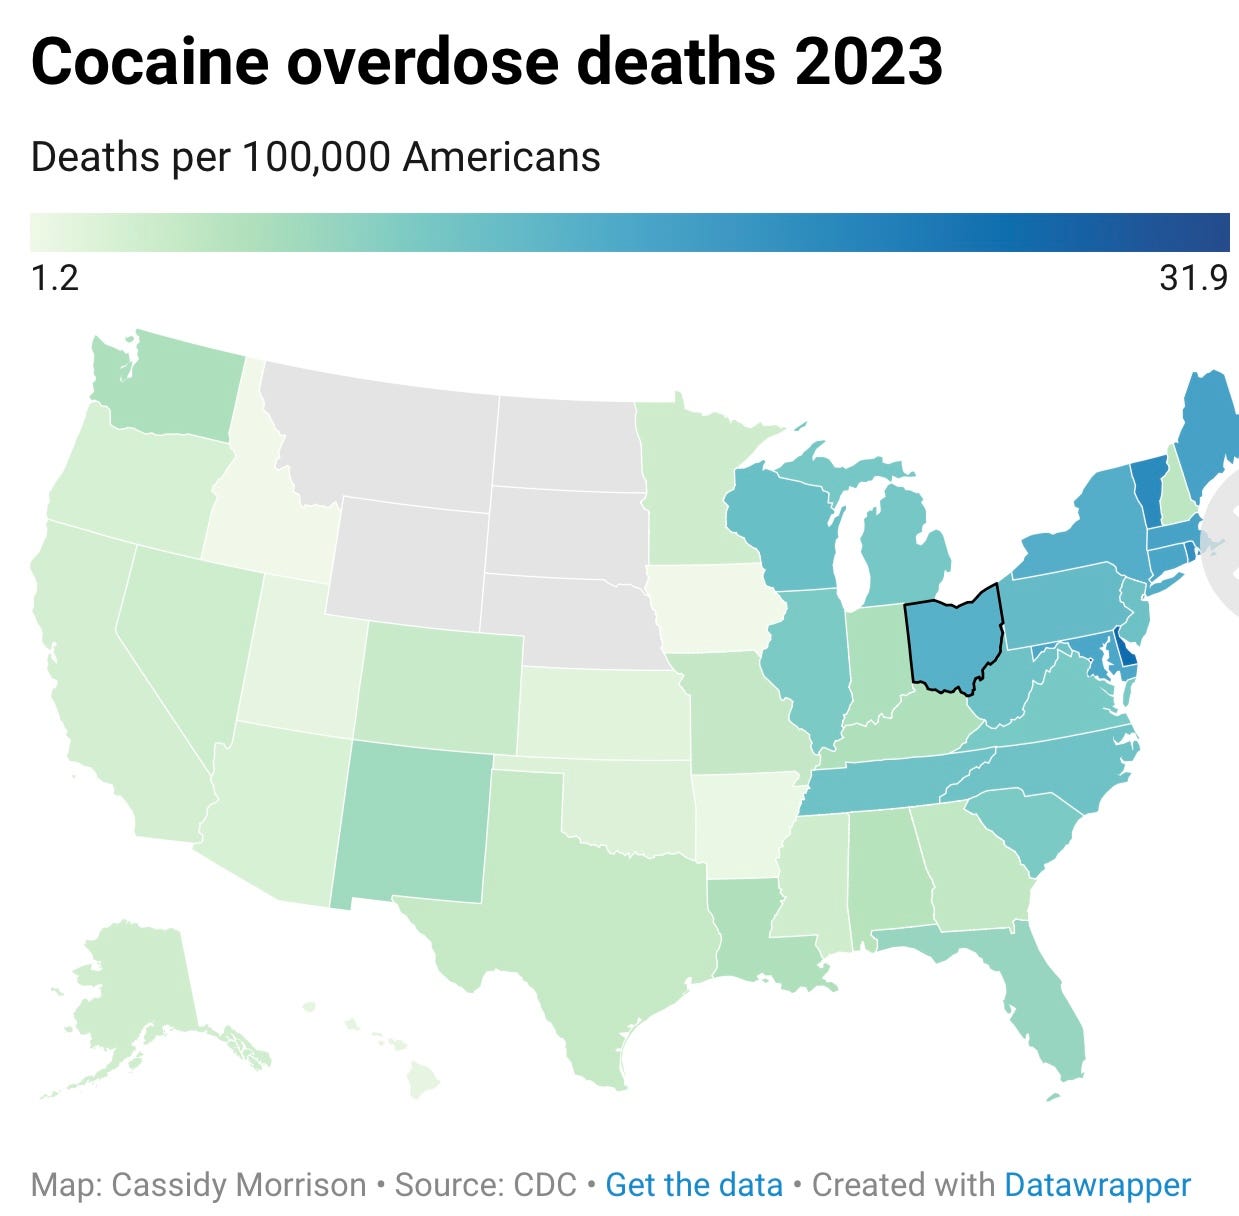
P.S. Here is another negative data point for Ohio on top of the above ones and its position in the top ten annual deaths from fentanyl overdoses year-after-year. In 2023, Ohio became one of the worst states for cocaine overdoes deaths. Perhaps it is only coincidental, but the top states for cocaine overdoses are also the most heavily pro-union states that experienced massive jobs losses from 1990 to 2024 and whose recoveries are impeded by being pro-Big Labor, which repels companies from going to those states versus right-to-work states (notice right-to-work neighbors Indiana and Kentucky aren’t suffering a similar fate as Ohio).

P.P.S. When Ohio’s elected officials meet with large Republican donors, they trot out three “facts” in support of their proposition that “all is well” in Ohio. First, they cite Ohio’s “low” unemployment rate, which I dismantled above. Next, they note the “record business filings” at the Ohio Secretary of State’s office every year. Finally, they point to Ohio’s high ranking in the annual Site Selection Magazine survey. On these two latter items, I’ve previously refuted those points in my “The Rise of Texas” column from last June. Specifically, I wrote:
For years, Ohio’s political leaders have bragged about two items. First, every year, our secretaries of State note that business filings have set a new record. Secondly, our governors cite Ohio’s usually high Site Selection ranking as proof that all is well in Ohio. My response to the first item is “where are the jobs to go with those annual business filings records?” Ohio’s private sector has been largely stagnant for years, so the business filings are not resulting in many jobs. The reality is the business filings likely just represent people starting LLCs in order to take advantage of the tax benefits of being a 1099 employer/employee versus a W2 employee.
On the Site Selection ranking, that ranking was created back in the 1990s with heavy influence by the Voinovich Administration. The Voinovich people pushed items that would artificially give Ohio a boost in the ranking. Plus, only two-thirds of the states actually participate in that ranking. Regardless, as with the business filings records, one must ask: "where are the jobs to go with the high Site Selection ranking"?
Do you see the complete disconnect between annual record business filings and consistently being ranked high for site selections versus the lack of private sector growth? In this case, 1 + 1 ≠ 3.
Matt, please weigh in on the bond issue that will go in front of voters in a special election in May. The legislature has set aside (wasted!) $15 million in taxpayer dollars to fund an election that will probably result in a 10% turnout. Why can't this wait until November? I typically work elections in my precinct but I said 'Not this time' to the county BOE out of principal. Here's hoping that Vivek can be the change agent we need in this state. And that he is open to your assistance.
Ohio voters are complacent to vote for anyone with an R next to their name, no matter how much they fail at representing strong conservative values. In Marion County, they re-elected Tracy Richardson and ousted Tom Edwards. Tom was the best thing to happen to Marion. Our crime and overdose rates were down. But he doesn't have the R. He is a strong Constitutional Conswrvative Independent who left the party due to party shenanigans. We reap what we sow. Tracy of course is Blue 22.